
Data Center Infrastructure
Data center infrastructure rests on four pillars: land, power, shell, and compute. A shortfall in just one of them stalls the entire project, no matter how strong the other three are. A stalled grid interconnection, a rack density mismatch, a blocked site permit, a building envelope that can’t support the load: any single one can do it.
In May 2026, a cooling failure inside a single AWS availability zone took down major compute and storage services for roughly 28 hours, with estimated losses above $25 million1. That outage shows how a shell or cooling failure cascades straight into a power and compute failure. Splunk and Cisco ran a separate 2026 study. It surveyed 2,000 executives across the Global 2000 and put the aggregate annual cost of unplanned downtime at $600 billion, up 50% in two years, or roughly $300 million per company per year2. Each of these figures measures the same underlying pattern: treating one pillar as more important than the others carries a real, quantifiable cost.
The table below breaks each pillar into the question it has to answer and what typically goes wrong when that question is not answered.
| Pillar | Core question it answers | Typical failure mode when overlooked |
|---|---|---|
| Land | Does the site clear technical, water, fibre, zoning, and environmental requirements? | Delays in zoning, permitting, or environmental approvals wipe out a seemingly ideal location |
| Power | Can the grid and backup systems support target IT load and redundancy tier? | Multi-year interconnection queue stalls the entire project |
| Shell | Is the building envelope and core infrastructure ready for fast fit-out? | A cooling failure inside the shell cascades into a multi-hour, multi-million-dollar outage |
| Compute | What rack density, storage mix, and network fabric does the workload need? | Shell cooling was sized for 5–15 kW racks. Modern GPU racks pull 30 to 150+ kW. Costly rework is common if compute requirements get locked in after the shell design is already frozen. |
The Four Pillars of Data Center Infrastructure
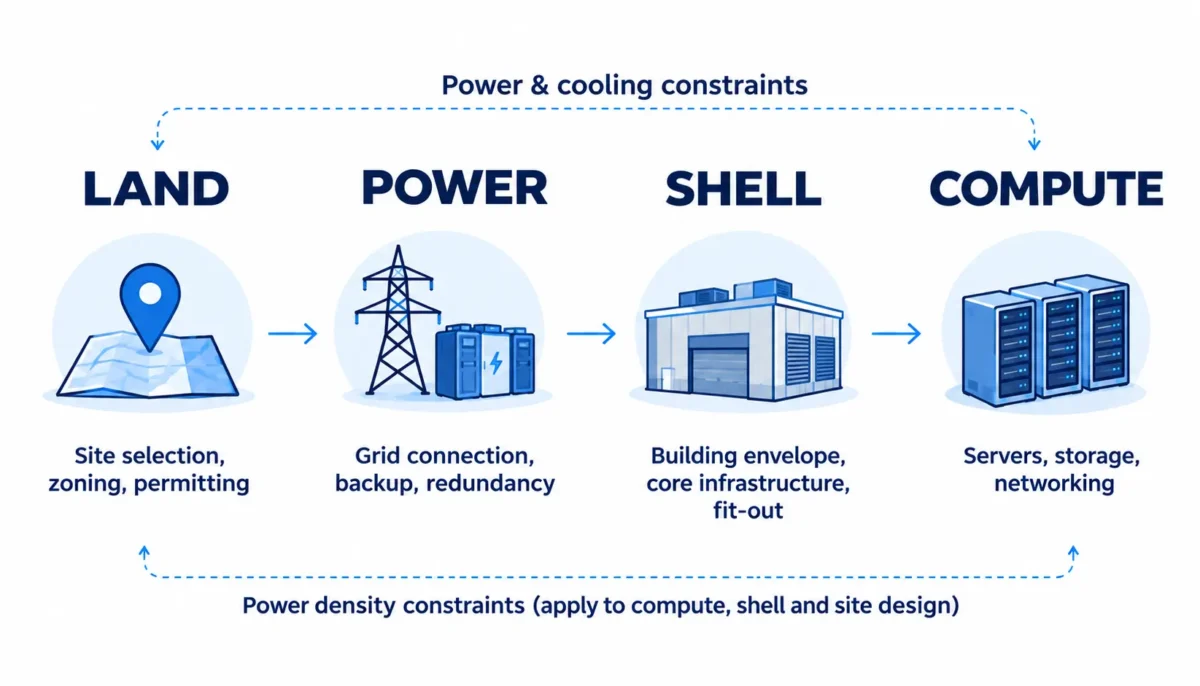
Data center infrastructure is less a single building and more a stack of four dependencies. Any one of them can become the binding constraint on a project.
- Land is the most underexplained pillar in most public content on this topic. It involves power grid proximity and substation capacity, water rights for evaporative cooling, fiber route access, zoning, permitting, and environmental permit timelines, seismic and flood risk, and, increasingly, community and planning approval as local opposition to large campuses grows. A parcel that looks perfect on a map can still take two to four years before a single foundation is poured.
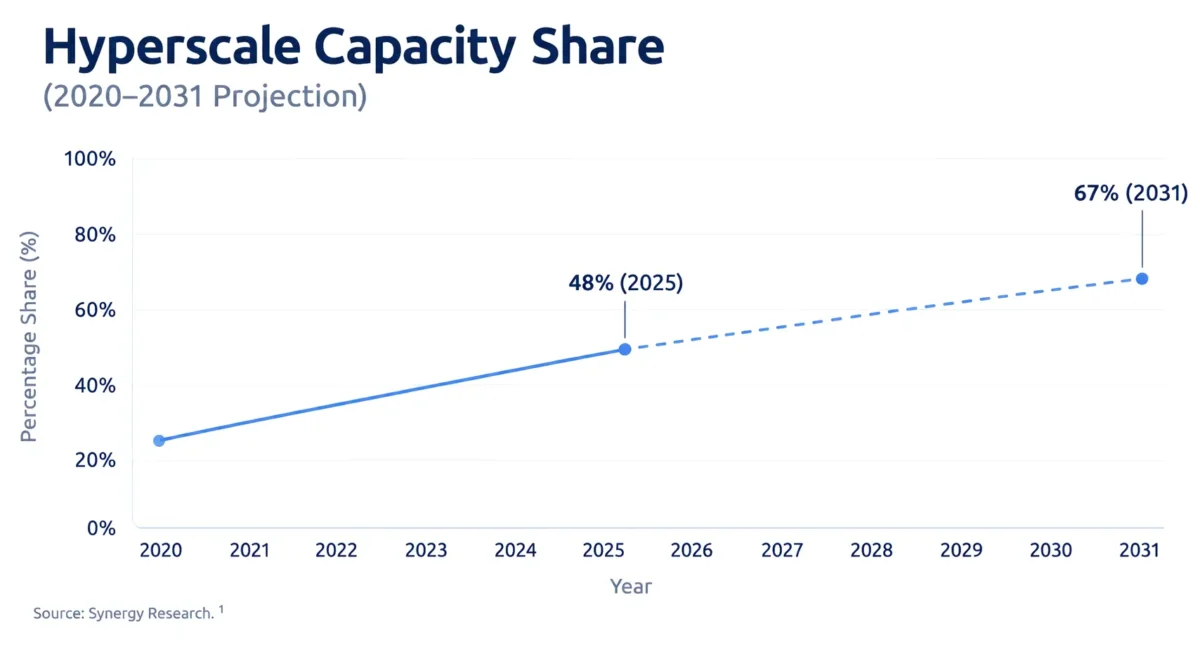
- Power is usually the first and hardest constraint to solve. It covers grid interconnection capacity, utility queue times, on-site backup generation, UPS systems, and redundancy design. In most major markets today, power availability is the primary gating factor on how fast new capacity can come online, ahead of land or capital. Synergy Research Group’s 2026 analysis shows hyperscale operators now account for 48% of worldwide data center capacity. That share is projected to reach 67% by 2031 as hyperscale capacity more than triples3. Growth at that pace only works because operators lock in power years before construction starts.
- Shell is the physical building envelope: walls, roof, structural floor loading, and the core electrical and mechanical backbone delivered before a tenant’s IT fit-out begins. A “powered shell” already has power and connectivity brought to the site, ready for a tenant to complete the interior build. This delivery model determines who carries construction risk, and it often marks the difference between a 12-month and a 30-month deployment timeline.
- Compute is the layer most people picture first, and it deserves a proper technical breakdown rather than a passing mention. Servers come in three main form factors:
- Rack-mount servers: self-contained units stacked in racks, each with its own power supply and cooling
- Blade servers: share power and network resources across a chassis to save space
- Mainframes: high-performance systems that can replace an entire room of rack-mount units
Compute density has shifted fast with the AI buildout. A traditional enterprise rack might draw 5 to 10 kW. An AI training cluster can require 80 to 150+ kW per rack, and that load cascades directly into the power and cooling design of the other three pillars. A shell built for 10 kW racks simply cannot host a modern GPU cluster without retrofitting cooling and electrical distribution. That’s the same kind of cross-pillar failure behind the AWS incident cited above.
Data Center Uptime Tiers (Tier I–IV)
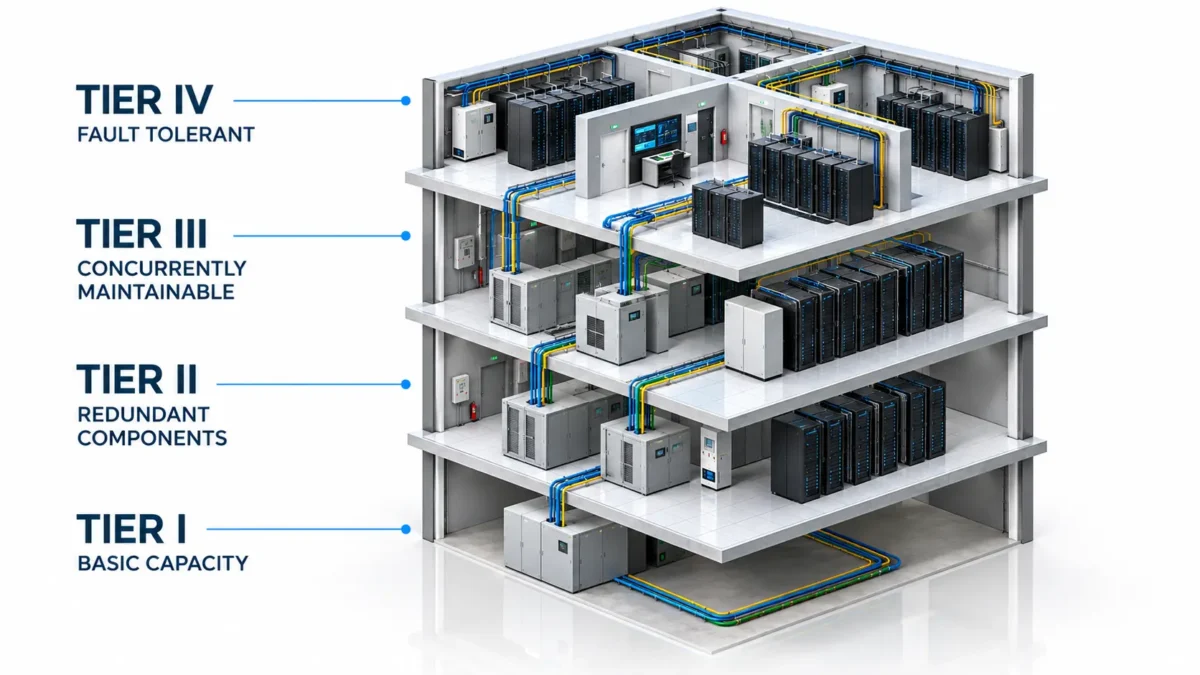
Every pillar of data center infrastructure needs a resilience layer on top of it, and this is where real buyer due diligence happens. The Uptime Institute’s four-tier system is the industry benchmark for data center resilience4. The differences between tiers can be quantified, not just labels; the uptime percentages and downtime figures below are the ones commonly cited across the industry, calculated from the Uptime Institute’s tier topology5.
| Tier | Redundancy | Maintenance Philosophy | Commonly Cited Uptime | Downtime per Year |
|---|---|---|---|---|
| Tier I | No redundancy (N); basic UPS and cooling capacity only, per the Uptime Institute’s definition4. | Any maintenance requires a full shutdown. | 99.671% | Up to 28.8 hours5 |
| Tier II | Partial redundancy (N+1) on components like generators and energy storage, but still a single distribution path, per the Uptime Institute’s definition4. | Maintenance still requires scheduled downtime. | 99.741% | Up to 22 hours5 |
| Tier III | N+1 redundancy across multiple distribution paths, making the facility concurrently maintainable. | Maintenance never requires a shutdown, per the Uptime Institute’s definition4. | 99.982% | Up to 1.6 hours5 |
| Tier IV | Full fault tolerance through physically isolated, independent redundant systems, per the Uptime Institute’s definition4. | A single equipment failure has zero operational impact. | 99.995% | Roughly 26 minutes5 |
These uptime percentages and downtime-per-year figures are commonly cited industry estimates, not official metrics published by the Uptime Institute, which defines each Tier solely by redundancy, maintainability, and fault-tolerance criteria.
To Environmental controls sit alongside tiering as recurring root causes of outages. Temperature control (air and liquid cooling), humidity control, and fire suppression are standard categories. Security spans physical access control and cybersecurity; hyperscale facilities in particular need specialized firewalls and layered physical security given the concentration of tenant data.
Downtime has a real commercial cost. Splunk and Cisco’s 2026 research showed. Once lost revenue, regulatory fines, and remediation costs are combined, the average works out to roughly $900,000 per hour, per company, across the Global 20002.
Hyperscale vs Colocation: Two Data Center Infrastructure Models
Hyperscale and colocation are different ownership and operating models for the same data center infrastructure. The choice between them determines who controls land, power, shell, and compute, well beyond who simply owns the building.
- Land is where the two models diverge earliest. Hyperscale operators can sometimes acquire or option a site directly, sometimes years before a single permit is filed, specifically to lock in substation proximity and room to expand. Colocation tenants skip this step entirely. The operator has already fought that battle, zoning, permitting, grid access, so the tenant never has to.
- Power. In a hyperscale model, the tenant procures power directly. That means negotiating with utilities one-on-one, and increasingly co-investing in grid upgrades or on-site generation to match a specific load curve years before the facility goes live. Colocation flips that entirely: the operator owns the utility relationship, and the tenant simply buys capacity as a service, trading redundancy control for a much shorter runway to power-on.
- Shell. A hyperscale shell is built around one tenant’s exact power and cooling specification, down to the floor loading and rack layout. Colocation goes the opposite direction. A general-purpose shell lets an operator retrofit and hand it off to a different tenant next year, which is precisely the trade-off: customization against speed and shared risk.
- Compute. Hyperscale tenants build to their own workload. Rack density, cooling method, network architecture, all specified in-house, often with custom liquid-cooling systems designed years ahead of deployment. Colocation works the other way around; the tenant fits into whatever density and cooling the facility already has, which gets them live faster but puts a hard ceiling on how far they can push AI-density workloads without negotiating a custom suite from scratch.
The financial scale behind these choices is significant. The global colocation market reached an estimated $83 billion in 2025 and is projected to grow to $92 billion in 2026, reaching roughly $218 billion by 2034 at a CAGR near 11.4%6. Hyperscale capex is harder to pin down. Synergy Research and Dell’Oro Group put total data center capex across all operator types near $600 billion for 20267. Equity-research estimates for the top five hyperscalers alone (Amazon, Microsoft, Alphabet, Meta, Oracle) range from $450 billion to $750 billion, depending on when the estimate was published8. That $300 billion spread on hyperscaler capex alone is itself a signal of how fast the market is still repricing its own growth assumptions.
Why AI Is Rewriting the Rules on All Four Pillars
AI compute demand is the single biggest force reshaping data center infrastructure right now, and it touches every pillar at once. The International Energy Agency’s July 2026 update to its Energy and AI analysis found that global data centre electricity demand grew 17% in 2025, reaching roughly 485 TWh. AI-focused data centres grew even faster: consumption there jumped 50% in the same year9. The IEA’s central projection sees total consumption roughly doubling to about 950 TWh by 2030. That would account for close to 3% of global electricity demand, slightly more than Japan’s entire current consumption9.
- Land hasn’t disappeared as a constraint, it’s just changed shape. Cheap acreage means nothing anymore. What matters is whether a site sits close enough to a substation with real spare capacity, which is a much smaller and more contested list of places than it used to be.
- Power has overtaken land as the primary constraint in most developed markets. Grid queues, not construction timelines, now decide who builds next.
- Shell is where the mismatch shows up physically. Buildings engineered for air-cooled racks a few years ago are now being retrofitted mid-life, at real cost, because the shell simply wasn’t built for what’s running inside it today. The AWS cooling-related outage cited earlier isn’t an isolated incident. It’s a preview of how AI-driven density is stress-testing infrastructure built for a different era, across all four pillars, not just one.
- Compute is changing just as fast, and the two are linked. Legacy racks were designed to draw 4 to 8 kW. AI GPU racks now require 40 to 130 kW10, and Nvidia’s next-generation Vera Rubin NVL72 is expected to consume around 210 kW per rack10. Air cooling caps out at 30 to 40 kW per rack. Past that rack density threshold, facilities need direct-to-chip liquid cooling, and increasingly immersion cooling, along with denser power delivery and shorter network runs to keep thousands of GPUs synchronized10,11. A facility engineered five years ago for 5 kW racks simply has nowhere to put that load.
As demand for AI and cloud infrastructure continues to grow, competition for power, connectivity, land, and capital will only intensify. Understanding how these four pillars interact is becoming a prerequisite for successful data centre development.
Yamna develops integrated energy and digital infrastructure projects designed to meet the evolving requirements of next-generation compute. We welcome conversations with developers, investors, utilities, and future occupiers shaping this rapidly growing sector.
Frequently Asked Questions
What is data center infrastructure?
Data center infrastructure is the combined set of physical and operational systems required to build, run, and scale a facility: land, power, shell, and compute.
What are the four main components of data center infrastructure?
Land, power, shell, and compute. Land covers site selection, zoning, and utility access. Power covers grid connection and backup systems. Shell covers the physical building envelope and core infrastructure delivered ahead of tenant fit-out. Compute covers servers, storage, and networking.
Should I choose hyperscale or colocation?
It depends on control, speed, and capital tolerance. Hyperscale suits organizations that need full design control and have the capital and timeline for owned or build-to-suit development. Colocation suits organizations that need scale quickly without taking on real estate and power procurement risk directly.
How much does data center downtime actually cost?
Splunk and Cisco’s 2026 research puts the aggregate cost of unplanned downtime for Global 2000 companies at $600 billion a year, or about $300 million per company annually2. Uptime Institute separately found 57% of operators reported their most recent major outage exceeded $100,000, and one in five exceeded $1 million12.
Why is power the biggest constraint on new data centers in 2026?
Grid interconnection queues in many markets now run multiple years. The IEA reports data centre electricity demand grew 17% in 2025 alone, so operators increasingly secure power capacity years before breaking ground9.
How much rack density do AI data centers need?
Traditional data centers were built for 4 to 7 kW per rack. Modern AI GPU racks need 40 to 130 kW, and some next-generation racks are expected to reach 370 kW10. Above roughly 30 kW per rack, air cooling alone struggles to keep up, so direct-to-chip liquid cooling is becoming standard rather than optional11.
What is PUE in a data center?
PUE, or power usage effectiveness, measures how much of a facility’s total power goes to actual computing versus overhead like cooling and lighting. Well-run modern facilities typically target 1.2 to 1.4, while older or poorly optimized sites can run above 2.0. A lower PUE means more of what you pay for goes to compute.
What do N, N+1, and 2N redundancy mean?
N, N+1, and 2N describe how much backup capacity a facility has beyond the bare minimum needed to run. N+1 adds one spare unit, so a single component can fail without an outage. 2N fully duplicates the system, giving two independent, complete paths for power or cooling.
Sources
2 - Cisco Newsroom / Splunk — The $600 Billion Wake-up Call: New Splunk Research Reveals Downtime Is a Systemic Business Crisis
3 - Synergy Research Group — Hyperscale Operators to Account for 67% of all Data Center Capacity by 2031
4 - Uptime Institute — Tier Classification System
5 - Uptime Institute — Tier Classification System — commonly cited uptime and downtime figures
6 - Fortune Business Insights — Data Center Colocation Market Size, Share, Growth Report, 2034
7 - Dell'Oro Group — Data Center IT Capex
8 - Dell'Oro Group — AI Boom Drives Data Center Capex to $1.7 Trillion by 2030
9 - International Energy Agency — Key Questions on Energy and AI: Executive Summary
10 - Hashrate Index — NVIDIA Vera Rubin NVL72: Full Specs & Platform Breakdown
11 - Bloom Energy — 2026 Data Center Power Report
12 - Uptime Institute — Global Data Center Survey 2025